Traditionally, farming was a manual industry run by families and communities with various practices passed down for generations with little science behind it. However, those times are long-gone stereotypes. Farming has modernized, with know-how and technological advances in all aspects of agriculture. To make the most out of the industry, 21st-century agricultural stakeholders need to leverage the different types of agronomic data to optimize their agricultural operations.
Smart decisions start with smart databases
From pre-planting to post-harvesting and warehousing, the agricultural data chain involves disparate data from different systems at different times. This chain consists of a technical layer that captures raw data and converts it into information and an operational and business layer that assists in decision making and derives value from data services and business intelligence. The two layers can be interwoven at each stage, forming the basis for what we know as the ‘data value chain’.
When you combine data from different sets, you can optimize growth, productivity, and profit, and improve benchmark performance in coming seasons. What’s more, data accuracy helps other agricultural bodies share information for greater collaboration. Consultative Group on International Agricultural Research (CGIAR)’s Platform Big Data in Agriculture, for example, seeks to connect and make use of various agronomic data to address climate change, food insecurity, and environmental degradation, as part of the United Nations’ Sustainable Development Goals.
To understand the complexity of collecting and analyzing agricultural data, let’s break it down:
- Pure agronomic data which includes the data related to the plants themselves. This data can include the phenological stage and the physical characteristics of the plants or fruits at each stage, leading to decisions such as recommendations for pest treatment and yield estimation. As a tangible example, growers might be interested in measuring the size of a particular fruit and their color or weight to assess whether or not they are ready to be picked. One more example is cotton. Cotton height must be continuously monitored, as overgrowth may negatively affect yield. In irrigated cotton, the measured height may affect the irrigation strategy. In rainfed cotton, it may lead to a decision of spraying the crop with growth inhibitors. As agricultural fields can be located in areas that are physically hard to reach, the collection of data can be difficult and expensive. Collecting, measuring, and analyzing data often requires humans to actually be in the field, monitor progress, and repeat measurements over time. Increasingly, remote sensing including satellites and even on-plant sensors have become effective tools to gain quick insights and reduce the costs of manual measurement. Even then we believe that on-ground data collection is required for validation and continuous upgrading of the models.
- Operational data. From spraying to harvesting, plowing to fertilizing, operational data includes information on materials, human resources, machinery, and more. This data category is useful throughout the plant cycle to measure the productivity and effectiveness of resources used in the production process. Farmers derive operational data mainly through manual reporting from fields and increasingly through automatic sensors positioned on machinery. There are also several semi-automated tools to simplify the data collection process, such as barcode or fingerprint scanners to record physical presence. The challenges lie not only in implementing a suitable system to keep track of operational data in each activity but also in connecting the dots across the various systems to create a comprehensive picture of the overall process.
- Environmental data. This includes data regarding weather, soil, water, topography, and others that affect crop yield and quality, as well as management plans. For example, information on precipitation levels, drainage areas, humidity, and acidity affects irrigation planning and flood prevention. More environmental data is increasingly available through aerial imagery sensors, weather stations, and others. However, as we operate on 5 different continents, we note that in some parts of the world this data is still collected manually by human scouts, such as rain gauges. If done accurately and systematically, it can serve as a fit-for-purpose tool in the broader decision-making process. Similar to the operational data, each stakeholder has to define what parameters to be observed, implement an appropriate monitoring system, then make sense of several complex data to make effective decisions.
Each of these three data sets is a whole database by itself and has great value. However, to take full advantage of these data and their sources, one needs to understand them in a comprehensive and dynamic way – making sure they interact with each other in a way that turns this data into actionable insights. As the world’s natural resources face environmental and political challenges, the World Government Summit in collaboration with Oliver Wyman, issued this interesting Agriculture 4.0 – The Future of Farming Technology report. One of the main themes of this report is that governments and other agriculture ecosystem stakeholders need to take a different approach to agriculture to enable operations “to be more profitable, efficient, safe, and environmentally friendly.” When you focus on the right data at the right time, you can support the foundations of Agriculture 4.0 and optimize modern farming.
Exploring through real-life examples:
Working with each data set separately can create data information silos – i.e. isolated piles of information. Silos are a good short-term solution but don’t fare well for long-term insights and forecasts.
Based on our experience working with many ag stakeholders worldwide, we want to share the following use cases which illustrate the benefits of having all relevant agronomic data in one place for holistic decision-making:
- Spray accurately. Even when growers are already electronically collecting and storing data, when they use disparate dashboards they can determine where and when to spray their crops. But to do so they need to access weather data on one screen while reviewing pest information and previous pesticide records on another, which can be confusing and time-consuming. If you use a single platform that combines all data, you will be able to gain a holistic view and cross-reference your data all in one place. You can make more informed – even automated – decisions about where and when to spray. The example below shows a predictive model to support spraying decisions, built on multiple data sets, including irrigation, historical spraying, pest and disease, temperature, and precipitation. Some data is automatically collected via sensors, while others via human scouting.
- Pick. Yield. Maneuver. How do you interact with data detected from machinery about harvest? How do you plan the collection transport? While machinery will tell you what percentage of the plot was covered already, it won’t be wise about the overall logistics planning. The example below shows the cotton harvest map with the relative yield per point in the fields. In addition, cotton bales are geo-located (white squares) and classified by weight and moisture content. This allows for smarter logistic planning of pickup and transport of bales from the fields.
- Optimize irrigation. Irrigation is crucial for high-value crops from a timing and quantity aspect. Often, the information involved in making irrigation decisions takes into account weather forecasts, previous irrigation records, water levels within the plant, and overall agronomic management strategy. Each variable is derived from a different source including weather stations, irrigation controllers, and field measurements. Being able to process all this data together against an agronomist’s stem water strategy is a powerful decision-support tool for water management.
We could provide plenty more examples based on our customers’ success stories, but you get the idea, right?
Advantages of a ‘one platform – one database’ approach
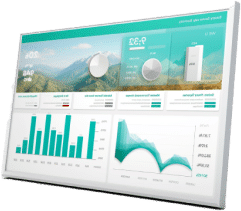
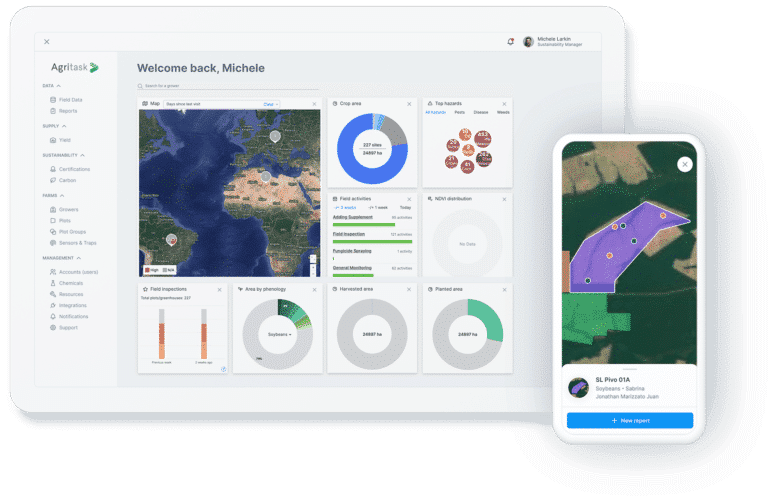
Adopting a single agronomic database approach provides many advantages for various stakeholders across the agriculture ecosystem. With a centralized dashboard, you gain enhanced visibility into all data sources. By methodically gathering and analyzing data, you can drive value across all agricultural activities, including field operations.
Aggregated data. Efficient actions in the field.
Delivering real-time data is important, and displaying data in a coherent format makes it easier to understand what is happening in the fields. What’s more, enhancing the data with inputs from other areas, such as materials, machines, human resources, and more. One single platform easily turns this data into actionable insights and can improve efficiency by reducing misuse of machinery, reducing waste and optimizing inputs.
Regaining control of resources.
One of the main challenges in the industry is the lack of control over resources. While environmental factors cannot always be anticipated, a single platform can help you plan and manage your resources more effectively. For example, a central platform allows you to assign tasks, follow up on the performance, and benchmark the results based on real-time data. As a result, the system can help mitigate risks by enabling early actions based on automatic alerts and recommendations. In addition, clear records of performance can help identify the most effective resources for broader operational optimization.
Ready to reap an aggregated ag-tech solution?
When seeking an ag-tech platform, the ease of adoption is often as important as efficiency. Using an advanced ag-tech tool shouldn’t have to be convoluted or require any change in your existing work methods. As a philosophy, we work with customers regardless of their starting point – agronomically or technologically.
That’s why we developed a proprietary system architecture that makes it easy and quick to digitally reproduce your manual working processes, quantifying your data, and recording your activities. This technology enables a truly customizable solution for each of our clients. With the Agritask platform, you can make the most out of the same work routines and field procedures as before.
To sum it up
The time is ripe to improve efficiency and automate data. Centralizing all agronomic data on one platform not only maximizes efficiency but also helps achieve profitability. In addition, organizations can comply with Agriculture 4.0 values and meet the needs of an expanding population with depleting natural resources. Agronomists, farmers, and other important industry stakeholders are not going to be replaced by computers. On the contrary: By augmenting human skills and expertise with big data, the next generation of farmers will be better equipped to lead and train the industry workforce of tomorrow. Data-driven agriculture can provide smarter insights and set the ground for the sustainable agriculture of the future.